Air Quality Successes - Criteria Pollutants
Texas’ air quality has made huge strides in the past few decades. The state has devoted significant resources for air monitoring and research to advance the science and find innovative ways to improve air quality.
Statewide Criteria Pollutant Design Value Trends

Ozone
- Ozone is created by chemical reactions between oxides of nitrogen (NOX) and volatile organic compounds (VOCs) in the presence of sunlight.
- Ozone can cause breathing problems, especially for children, older adults, and those with asthma.
- Ozone in Texas has decreased by 26% since 2000.

Particulate Matter
- Particulate Matter less than 2.5 microns (PM2.5) are small particles emitted by or formed in the air from dust, fires, vehicles, and industrial processes.
- PM2.5 can cause heart or breathing problems, especially for children and older adults.
- PM2.5 in Texas has decreased by 40% (24-hour PM2.5) and 13% (annual PM2.5) from 2002 to 2023.

Nitrogen Dioxide
- Nitrogen Dioxide (NO2) is a gas that is emitted into the air from cars, trucks, power plants, and off-road machinery.
- NO2 can cause breathing problems, especially for children, older adults, and those with asthma.
- NO2 in Texas has decreased by 24% (one-hour NO2) and 25% (annual NO2) since 2000.

Sulfur Dioxide
- Sulfur Dioxide (SO2) is a gas emitted into the air from sources that burn fuels containing sulfur.
- SO2 can cause breathing problems, especially for children, older adults, and those with asthma.
- Several new source orientated SO2 monitors were installed in 2016 and 2017, causing the increase in the statewide one-hour SO2 design value. Air quality plans to address these sources were finalized in 2022.

Carbon Monoxide
- Carbon Monoxide (CO) is a gas that is emitted into the air from cars, trucks, and other combustion processes.
- CO reduces the amount of oxygen delivered into your body and can cause death at high levels.
- CO in Texas has decreased by 76% (one-hour CO) and 78% (eight-hour CO) since 2000.
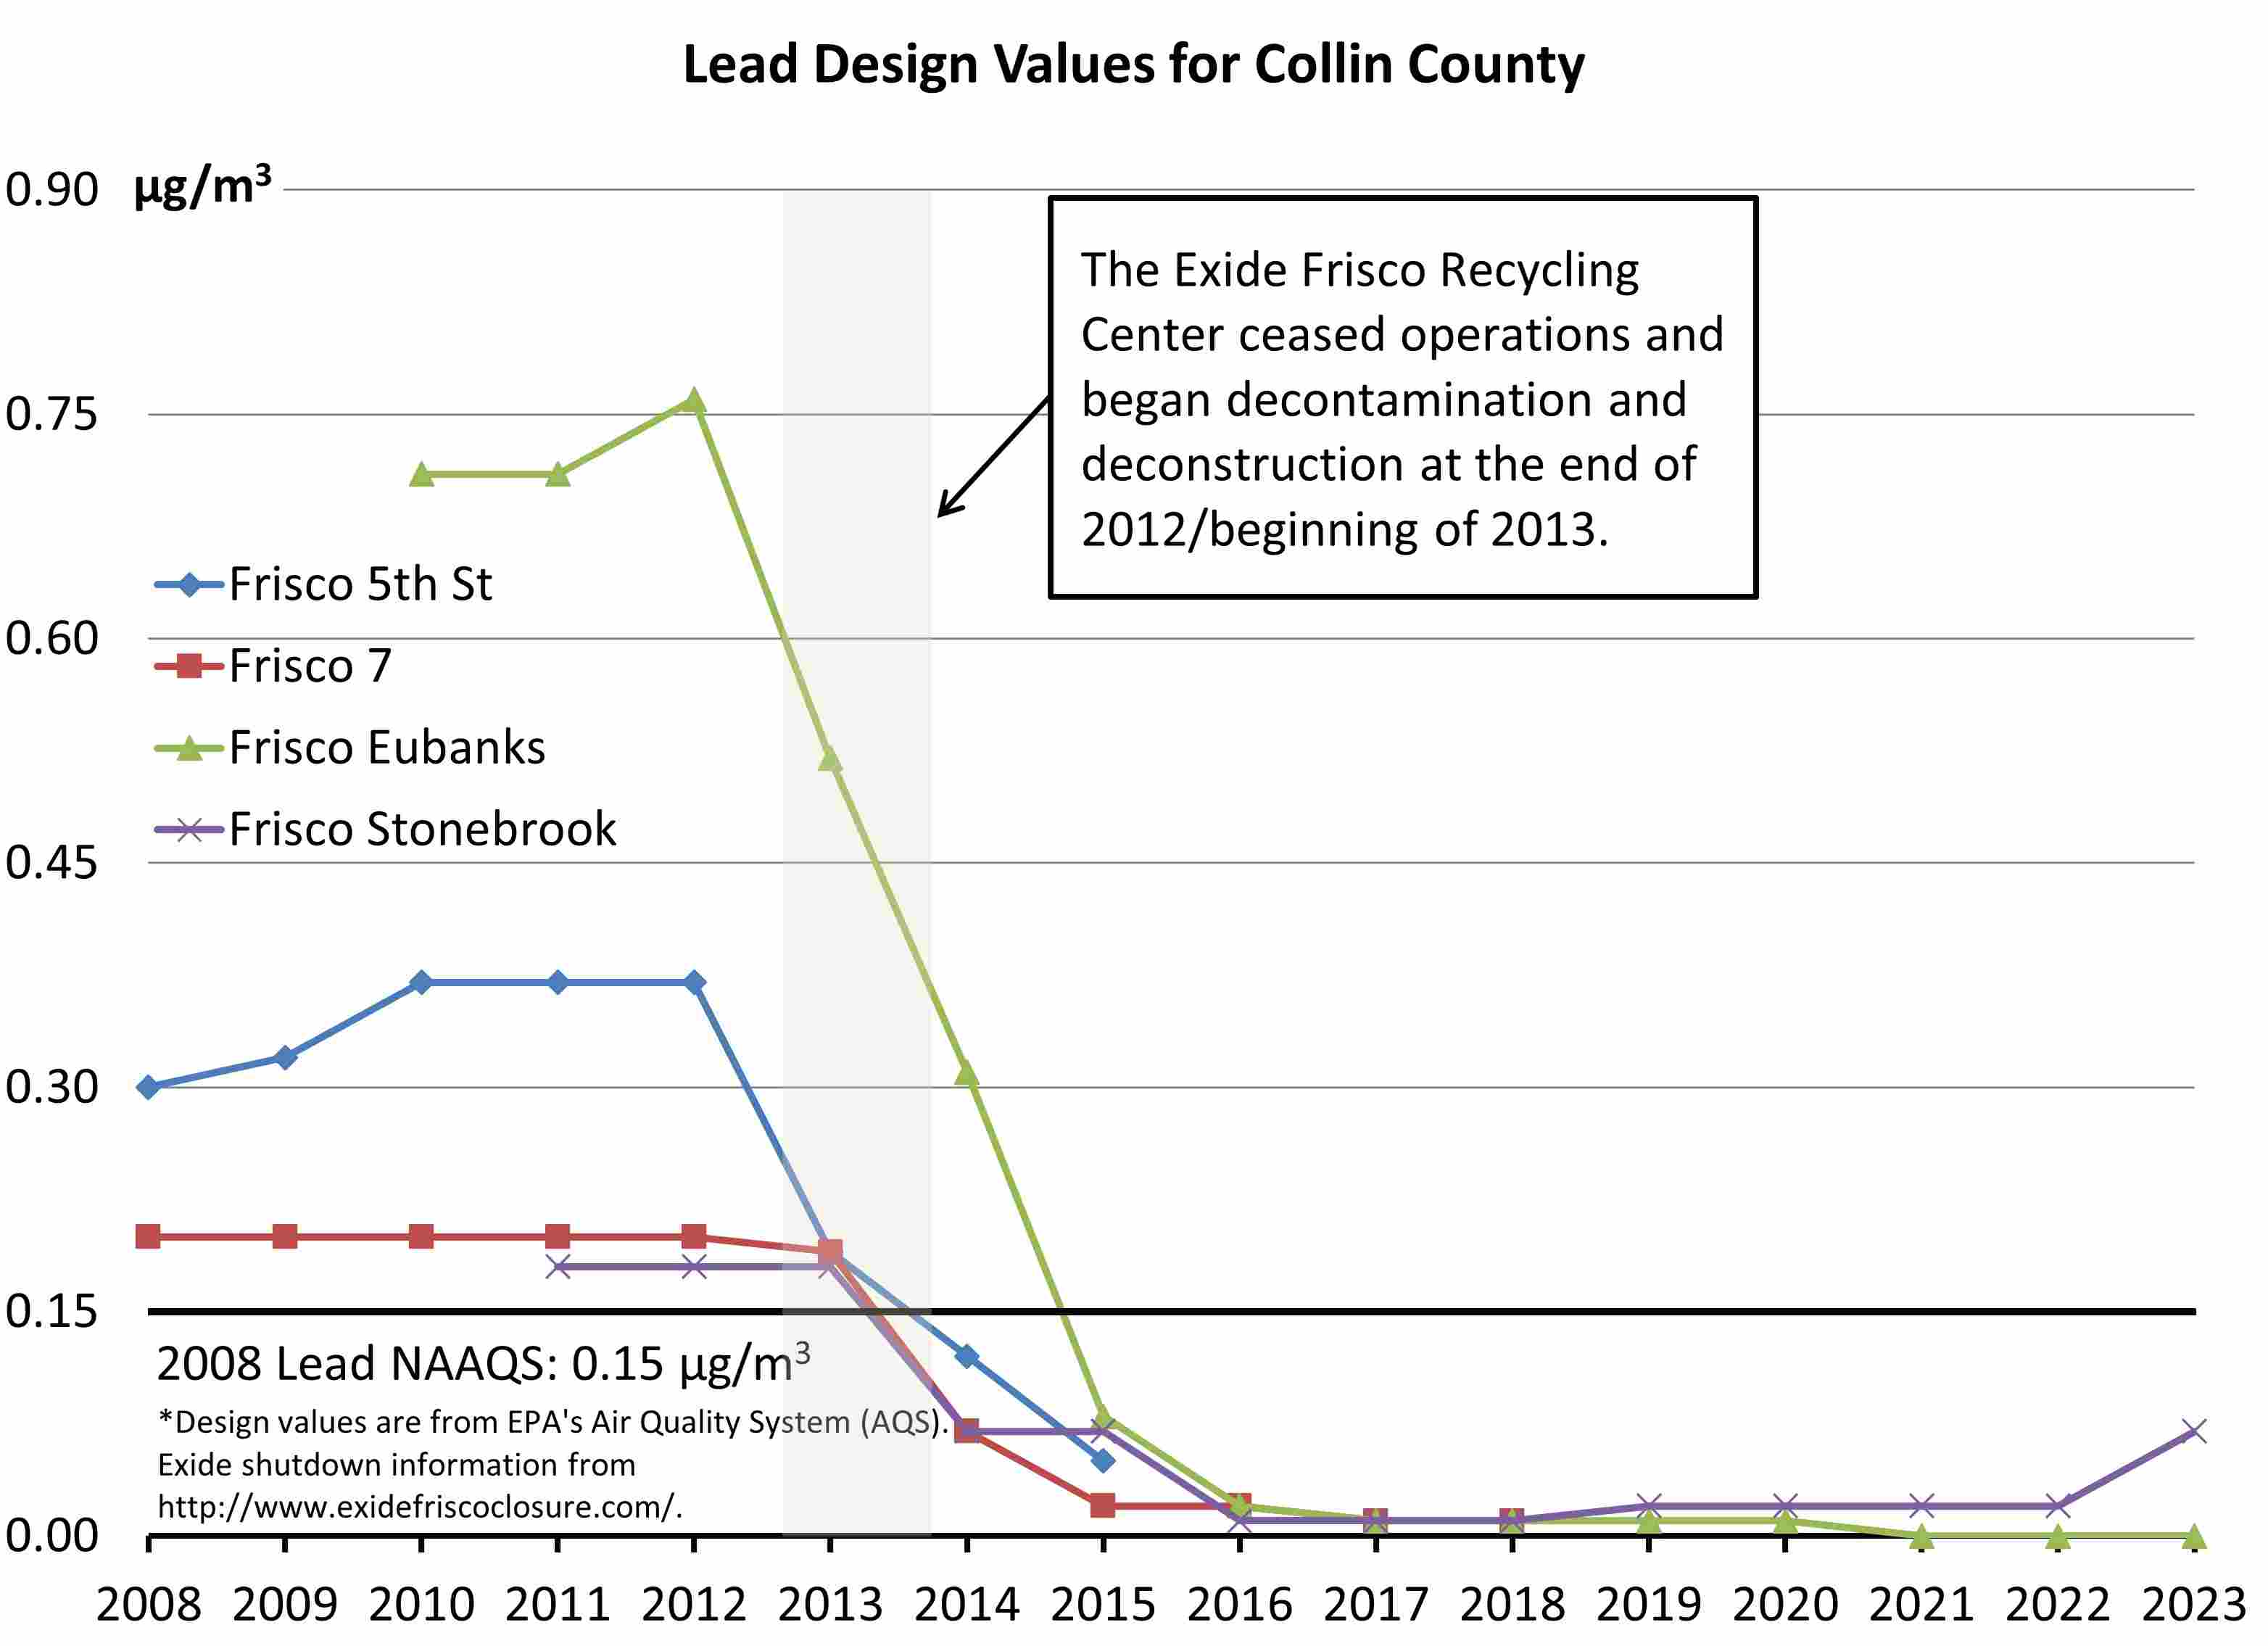
Lead
- Lead (Pb) pollution is emitted directly from industrial sources or lead-containing fuels.
- Lead exposure can lead to neurological, cardiovascular, and other health effects.
- The lead design value for the Frisco Eubanks monitor, closest to the former Exide Frisco Recycling Center, has decreased 100% from the year of the center’s closing (2012).